
Live Complexity Training
Introduction to Live Complexity Training for Biofeedback and Neurofeedback (EEG)
Always Under Construction - Last modified: August 26, 2021
Your life exhibits complexity!
Shouldn’t your physiological signals?
Live complexity training (LCT) is a theory driven implementation of Technology-Assisted Self-
Regulation / Self-Realization (TASR).
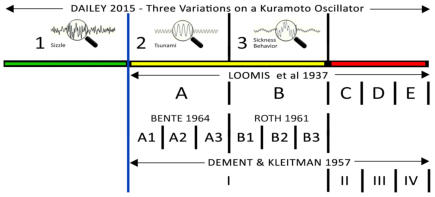
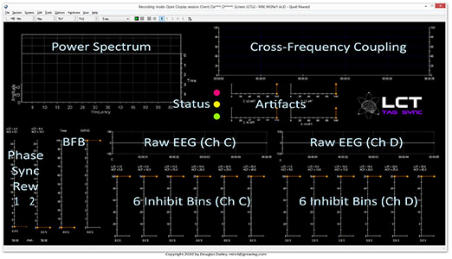
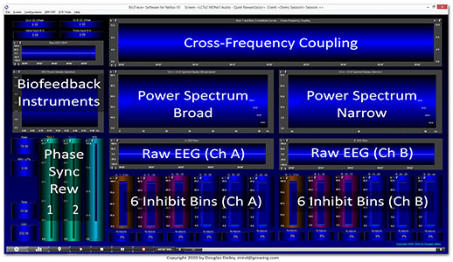
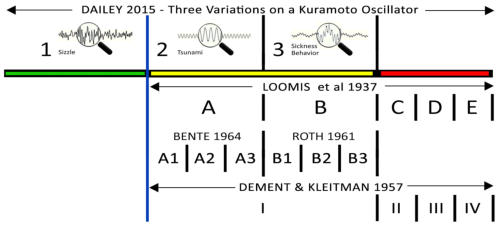
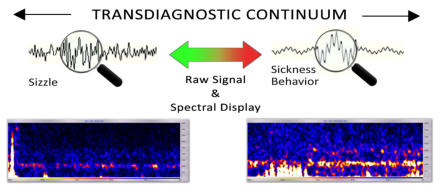
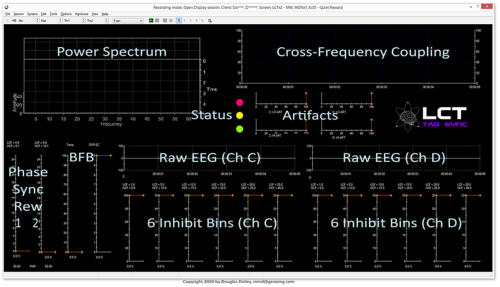
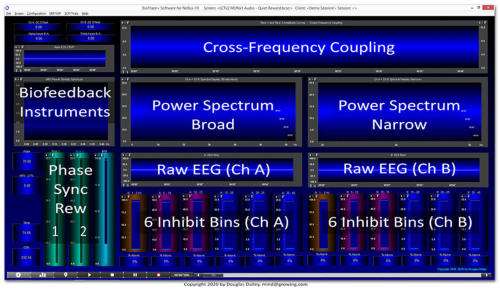
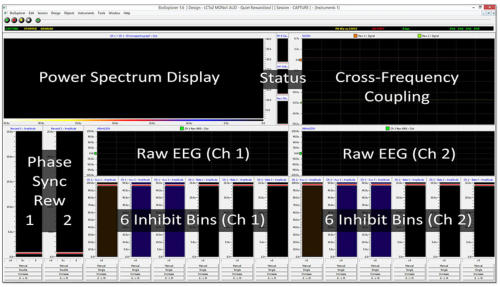
• Unlike neurofeedback and biofeedback procedures for management of diagnostic categories, LCT employs a transdiagnostic biomarker of sickness and wellness behavior as a “pointing-out instruction”, i.e., feedback. • Changes in complexity in physiological measures (e.g., EEG, HRV, GSR, fNIR, MRI, MEG) are often easy to see on screen as they occur. They are more difficult to describe mathematically and statistically. • Observable complexity in activities of body, feelings, and mind increases during successful recovery from sickness as well as in adaptive maturation. • Signal complexity increases in order to transmit and process our accumulation of memory and skillful means. • Complexity is only generated by the body-mind when there is healthy balance between excitation and inhibition (“self-organized criticality”) and when there is adequate neuroplasticity and neuroprotection. • Complexity increases as we develop gracefulness and problem solving abilities and express wellness behavior. • Complexity decreases as a result of most forms of sickness behavior. • Complexity without synchrony is randomness; Synchrony without complexity is rigidity.. I introduced Live Complexity Training in 2015 as an expansion of my earlier development of TAG Sync neurofeedback around 2010 [https://tagsync.com]. In 2015 I used a Kuramoto oscillator model to suggest three fundamental modes that identified the continuum between wellness behavior (adaptive development) and sickness behavior. This continuum is transdiagnostic (independent of diagnosis). Adaptogens cause movement to the left. By monitoring this biomarker one can evaluate the results of various interventions. During the COVID pandemic this is a particularly important issue since traditional face-to-face diagnoses are often not possible. A transdiagnostic biomarker may be preferable to the problem of multiple comorbidities. Adaptive development and maturation into skillful awakeness can be derailed by combinations of factors ranging from transgenerational epigenetic factors and early life adversity to trauma, toxins, and autosuggestion. Having a tool to point out the return of wellness behavior may sometimes be more fundamental than fumbling over the current ICD and DSM codes for multiple comorbidities. When we are growing up, when we are waking up, when we are evolving from the cradle to the council our physiological signals such as EEG, HRV, GSR, etc., show more and more of a signal I call Sizzle (see illustration above). When you zoom in to the complexity of wellness behavior you see the inner story - more complexity - just like when you dissect living tissue. By contrast when you suffer from delayed development, sleep deprivation or sickness behavior your EEG, when zoomed in upon, shows fast waves riding on slow waves - the EEG of sickness behavior. Since these signals are easy to see visually, and even easier to catch using digital quantification, why not use Technology-Assisted Self-Regulation / Self-Realization (TASR) to document which actions promote sickness behavior and which actions promote awakeness and skillful means? The Theory A good theory gives you testable predictions and is consistent with trends in current literature. Theories are neither true nor false, they are simply useful/skillful or not. Using a Kuramoto Oscillator model I have shown that physiological signals have three main easily seen variations that I call 1) sizzle, 2) tsunami, and 3) sickness behavior. Below is an illustration of how this transdiagnostic biomarker fits in with current models of vigilance and sleep states. Below the green-yellow-red line above, to the right of the blue vertical line, you see the typical “states of loss of vigilance”, deepening to the right. They are descriptions of changes in the EEG signals associated with behavioral changes. They correspond to loss of fully awake connectedness and to deep disconnections characteristic of both sleep and sickness. I have added the state of adaptive complexification (“Sizzle”) as a new component of the standard vigilance models. The client often shifts reflexively and habitually along the continuum, suffering from the changes throughout the day, but in general not mindful of the rise and fall of the different states. In Live Complexity Training the client learns to recognize and regulate such changes as shown below. The spectral displays below show the same client before LCT on right and after LCT on the left. EEG authorities describe the healthy awake EEG as “almost random” and with no apparent patterns. I describe it as like the random sizzling of water in a frying pan. The texts are very clear that the common patterns of sickness behavior such as chronic encephalitis are generally patterns of fast waves riding on slow waves. You can see in the spectral display of sizzle (above left) that there is low energy both above and below the neat 10 Hz alpha peak. In contrast on the right above is the dissipative EEG of canonical sickness behavior (SBeh). In SBeh energy has entered the regions below and above the 10 Hz control signal. I call these regions the lower and upper alpha skirts respectively. This transdiagnostic continuum is characteristic of many of the physiological rhythms used for biofeedback. It is called the 1/f signal - "one over f". F stands for frequency. The important thing is that signal used to be called 1/f noise and pink noise. It is indeed almost random like white noise, but it is imbued with a hierarchical organization of dominant power in the lower frequencies. This may be seen as “cross-frequency coupling” (CFC). You can see in the above illustrated continuum that movement toward sickness behavior is accompanied by the appearance of higher power CFCs. At the same time that we want to inhibit the CFCs and excessive lower and upper alpha skirt activity seen in Sickness Behavior, we want to enhance the brain’s long distance synchrony in and around the main control frequencies. These include the Meyer-Traube-Herring wave at 0.1 Hz and the 10 Hz alpha EEG signal. With Technology-Assisted Self-Regulation / Self-Realization (TASR) we can construct feedback software that helps us to be mindful of state changes (cf, Abhidharma). Below are screen shots of Live Complexity Training software for 3 common systems - Thought Technology, Nexus, and BioExplorer. Each screen shot has a link to a page where you can view or download the related Operations Manual, Installation Guide, Screen Shots, etc. Thought Technology: [Enlarge Image] [View Documents] Nexus by MindMedia: [Enlarge Image] [View Documents] BioExplorer by Cyberevolution: [Enlarge Image] [View Documents] Manuals and documentation are available for all three versions at mindsupplies.com Learning to use the EEG as a transdiagnostic biomarker gives new power to feedback training. LCT Resources - Complexity [Download PDF] LCT Resources - Transdiagnostics [Download PDF] LCT Resources - Sickness Behavior [Download PDF]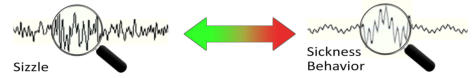
Copyright © 2010, 2015, 2021 by Douglas Dailey
There is a complexity-based transdiagnostic
biomarker of sickness behavior. Adaptogens
move the physiological signal away from
sickness behavior and toward adaptive
complexification.


Live Complexity Training
Introduction to Live Complexity Training for
Biofeedback and Neurofeedback (EEG).
Always Under Construction - Last modified: August 26, 2021
Your life exhibits complexity! Shouldn’t your physiological signals? • Live complexity training (LCT) is a theory driven implementation of Technology-Assisted Self-Regulation / Self-Realization (TASR). • Unlike neurofeedback and biofeedback procedures for management of diagnostic categories, LCT employs a transdiagnostic biomarker of sickness and wellness behavior as a “pointing-out instruction”, i.e., feedback. • Changes in complexity in physiological measures (e.g., EEG, HRV, GSR, fNIR, MRI, MEG) are often easy to see on screen as they occur. They are more difficult to describe mathematically and statistically. • Observable complexity in activities of body, feelings, and mind increases during successful recovery from sickness as well as in adaptive maturation. • Signal complexity increases in order to transmit and process our accumulation of memory and skillful means. • Complexity is only generated by the body-mind when there is healthy balance between excitation and inhibition (“self-organized criticality”) and when there is adequate neuroplasticity and neuroprotection. • Complexity increases as we develop gracefulness and problem solving abilities and express wellness behavior. • Complexity decreases as a result of most forms of sickness behavior. • Complexity without synchrony is randomness; Synchrony without complexity is rigidity.. I introduced Live Complexity Training in 2015 as an expansion of my earlier development of TAG Sync neurofeedback around 2010 [https://tagsync.com]. In 2015 I used a Kuramoto oscillator model to suggest three fundamental modes that identified the continuum between wellness behavior (adaptive development) and sickness behavior. This continuum is transdiagnostic (independent of diagnosis). Adaptogens cause movement to the left. By monitoring this biomarker one can evaluate the results of various interventions. During the COVID pandemic this is a particularly important issue since traditional face-to-face diagnoses are often not possible. A transdiagnostic biomarker may be preferable to the problem of multiple comorbidities. Adaptive development and maturation into skillful awakeness can be derailed by combinations of factors ranging from transgenerational epigenetic factors and early life adversity to trauma, toxins, and autosuggestion. Having a tool to point out the return of wellness behavior may sometimes be more fundamental than fumbling over the current ICD and DSM codes for multiple comorbidities. When we are growing up, when we are waking up, when we are evolving from the cradle to the council our physiological signals such as EEG, HRV, GSR, etc., show more and more of a signal I call Sizzle (see illustration above). When you zoom in to the complexity of wellness behavior you see the inner story - more complexity - just like when you dissect living tissue. By contrast when you suffer from delayed development, sleep deprivation or sickness behavior your EEG, when zoomed in upon, shows fast waves riding on slow waves - the EEG of sickness behavior. Since these signals are easy to see visually, and even easier to catch using digital quantification, why not use Technology-Assisted Self-Regulation / Self-Realization (TASR) to document which actions promote sickness behavior and which actions promote awakeness and skillful means? The Theory A good theory gives you testable predictions and is consistent with trends in current literature. Theories are neither true nor false, they are simply useful/skillful or not. Using a Kuramoto Oscillator model I have shown that phsyiological signals have three main earily seen variations that I call 1) sizzle, 2) tsunami, and 3) sickness behavior. Below is an illustration of how this transdiagnostic biomarker fits in with current models of vigilance and sleep states. Below the green-yellow-red line above, to the right of the blue vertical line, you see the typical “states of loss of vigilance”, deepening to the right. They are descriptions of changes in the EEG signals associated with behavioral changes. They correspond to loss of fully awake connectedness and to deep disconnections characteristic of both sleep and sickness. I have added the the state of adaptive complexification (“Sizzle”) as a new component of the standard vigilance models. The client often shifts reflexly and habitually along the continuum, suffering from the changes throughout the day, but in general not mindful of the rise and fall of the different states. In Live Complexity Training the client learns to recognize and regulate such changes as shown below. The spectral displays below show the same client before LCT on right and after LCT on the left. EEG authorities describe the healthy awake EEG as “almost random” and with no apparent patterns. I describe it as like the random sizzling of water in a frying pan. The texts are very clear that the common patterns of sickness behavior such as chronic encephalitis are generally patterns of fast waves riding on slow waves. You can see in the spectral display of sizzle (above left) that there is low energy both above and below the neat 10 Hz alpha peak. In contrast on the right above is the dissipative EEG of canonical sickness behavior (SBeh). In SBeh energy has entered the regions below and above the 10 Hz control signal. I call these regions the lower and upper alpha skirts respectively. This transdiagnostic continuum is characteristic of many of the physiological rhythms used for biofeedback. It is called the 1/f signal - "one over f". F stands for frequency. The important thing is that signal used to be called 1/f noise and pink noise. It is indeed almost random like white noise, but it is embued with a hierarchical organization of dominant power in the lower frequencies. This may be seen as “cross-frequency coupling” (CFC). You can see in the above illustrated continuum that movement toward sickness behavior is accompanied by the appearance of higher power CFCs. At the same time that we want to inhibit the CFCs and excessive lower and upper alpha skirt activity seen in Sickness Behavior, we want to enhance the brain’s long distance synchrony in and around the main control frequencies. These include the Meyer-Traube-Herring wave at 0.1 Hz and the 10 Hz alpha EEG signal. With Technology-Assisted Self-Regulation / Self-Realization (TASR) we can construct feedback software that helps us to be mindful of state changes (cf, Abhidharma). Below are screen shots of Live Complexity Training software for 3 common systems - Thought Technology, Nexus, and BioExplorer. Each screen shot has a link to a page where you can view or download the related Operations Manual, Installation Guide, Screen Shots, etc. Thought Technology: [Enlarge Image] [View Documents] Nexus by MindMedia: [Enlarge Image] [View Documents] BioExplorer: [Enlarge Image] [View Documents] Manuals and documentation are available for all three versions at mindsupplies.com Learning to use the EEG as a transdiagnostic biomarker gives new power to feedback training. LCT Resources - Complexity [Download PDF] LCT Resources - Transdiagnostics [Download PDF] LCT Resources - Sickness Behavior [Download PDF]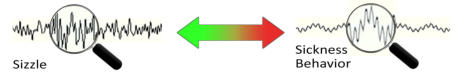
Copyright © 2010, 2015, 2021 by Douglas Dailey
There is a complexity-based transdiagnostic
biomarker of sickness behavior. Adaptogens
move the physiological signal away from
sickness behavior and toward adaptive
complexification.